
White Natural Versatile Plastic

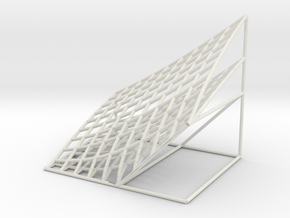
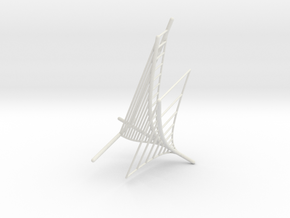
Option Wedge
Made by
Print With Shapeways
 Choose Your Material
 Choose your color and finish
$42.49
Have a question about this product?
contact the designerYou must be logged in and verified to contact the designer.
Product Description
The volume defined by the payout of a call option (on the y axis, depth) and the lognormal distribution (z axis, height) of the price of the underlying stock (on the x axis, width). Roughly equivalent to what the Black-Scholes-Merton formula calculates and discounts to the present. Two stocks are displayed, one with small standard deviation (thin tails) and one with large (fat tails). I am offering this with no markup.
Details
What's in the box:
OptionWedge20171026

Dimensions:
Success Rate:
First To try.
What's this?
Rating:
Mature audiences only.
