White Natural Versatile Plastic

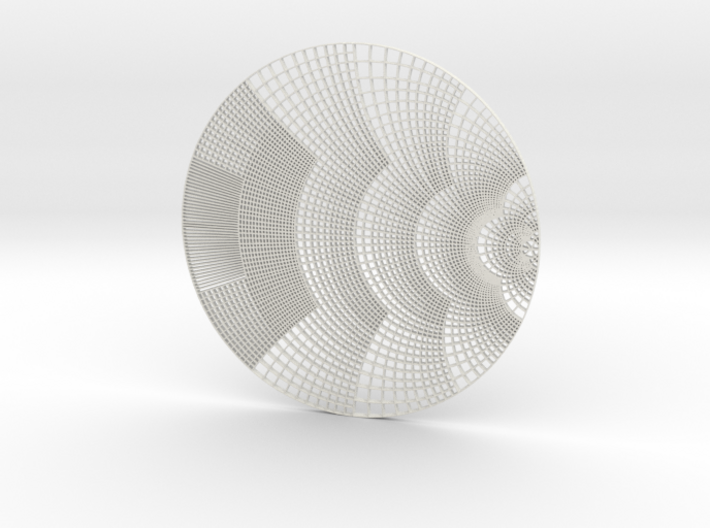
Smith Chart pendant
Made by
Print With Shapeways
 Choose Your Material
 Choose your color and finish
$11.51
Want to complete your necklace? Add A Chain
Have a question about this product?
contact the designerYou must be logged in and verified to contact the designer.
Product Description
The Smith chart was developed in the 1930s by Phillip Hagar Smith at Bell Laboratories as a way to show and evaluate multiple complex impedance parameters on a two-dimensional bounded graph.
Details
What's in the box:
SmithChart_pendant (repaired)

Dimensions:
Success Rate:
First To try.
What's this?
Rating:
Mature audiences only.

More From This Shop
$14.50
$87.00
$48.80
$45.31