


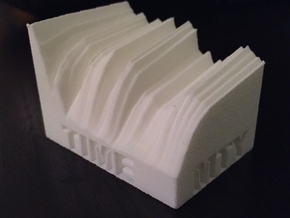
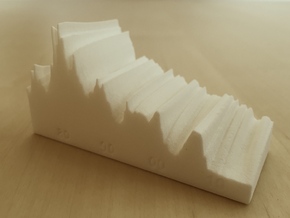
Central Park NYC Temperature since 1869
Made by
Print With Shapeways
 Choose Your Material
 Choose your color and finish
$63.43
Have a question about this product?
contact the designerYou must be logged in and verified to contact the designer.
Product Description
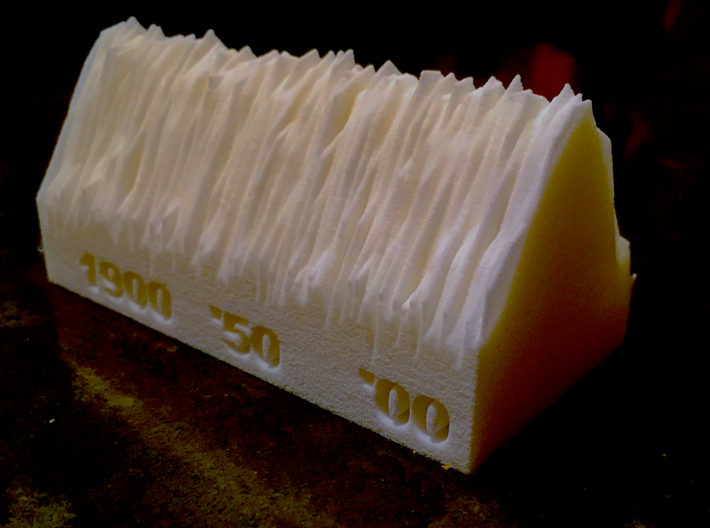
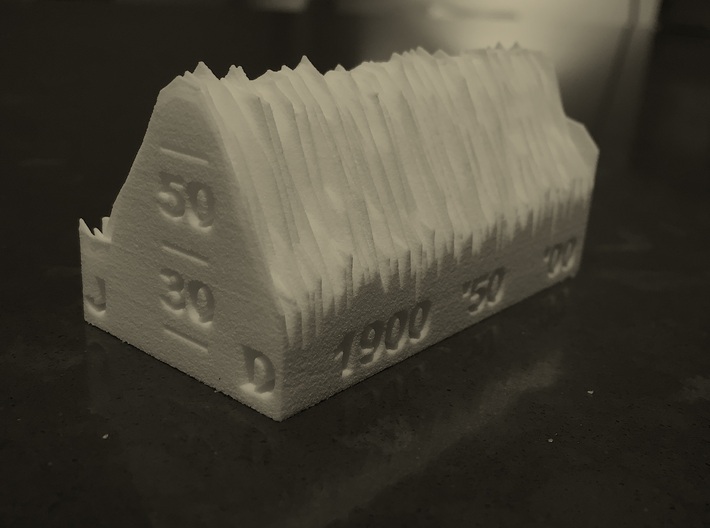
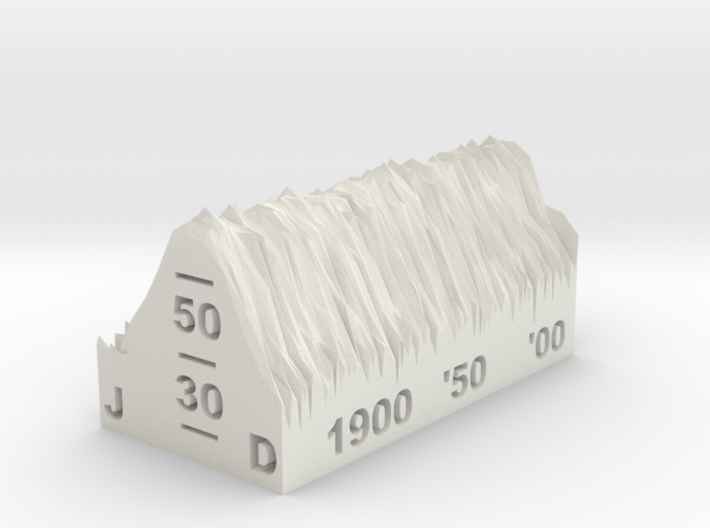
Seasonal visualization of monthly average temperaure in Central Park NYC since 1869. Data run through December 2015. A great visualization for those interested in meteorology, weather, or climate change. Explanation of axis labels: J and D indicate calendar months January through December. Temperature axis includes labels at 30 and 50 degrees F, with tick marks at 20, 40 and 60 degrees. Year axis includes labels at 1900, 1950, and 2000. Data sourced from the National Weather Service.
Details
What's in the box:
Central Park NYC Temperature since 1869

Dimensions:
Success Rate:
First To try.
What's this?
Rating:
Mature audiences only.

More From This Shop
$35.23

$32.40