


Network Visualization of US Economy by Industry
Made by
Print With Shapeways
 Choose Your Material
 Choose your color and finish
$23.34
Have a question about this product?
contact the designerYou must be logged in and verified to contact the designer.
Product Description
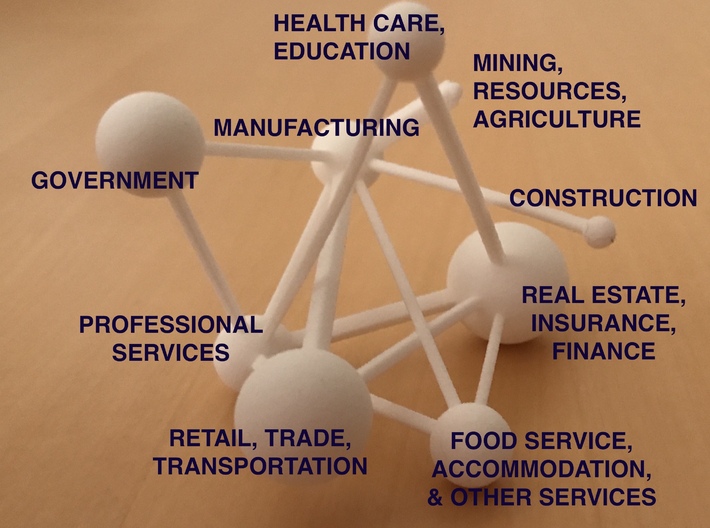
Network visualization of the US economy by industry. The size of the nodes represents the amount of industry value added. The size of connections between nodes represents the flow of intermediate inputs between industries. Only connections >$250bn are shown, for printability. Nodes are as follows: (1) agriculture, natural resources, and mining, (2) manufacturing, (3) construction, (4) trade, transportation, and utilities, (5) health care and education services, (6) real estate, insurance, and finance, (7) professional services, (8) government, and (9) all other. Data sourced from the use tables of the US input-output accounts, Bureau of Economic Analysis.
Details
What's in the box:
IO Use Producer Nov

Dimensions:
Success Rate:
First To try.
What's this?
Rating:
Mature audiences only.

More From This Shop

$35.23

$32.40