


Riemann Zeta Curve
Made by
Have a question about this product?
contact the designerProduct Description
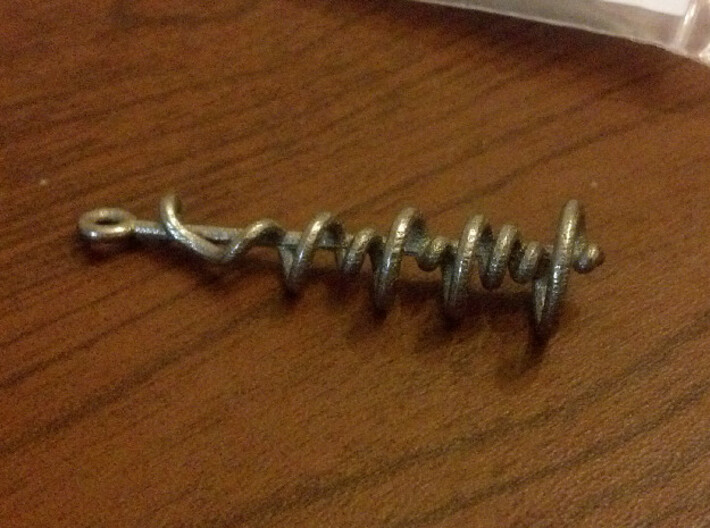
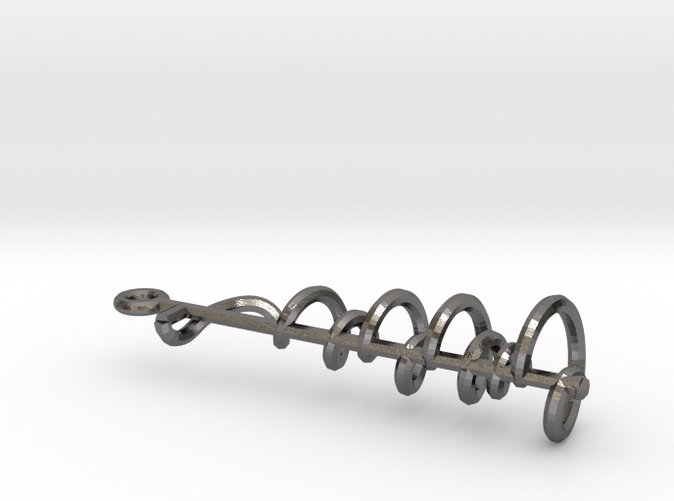
This is a parametric graph of the Reimann Zeta Function, on the critical line ℜ(z)=1/2, in the region 0 ≤ ℑ(z) ≤ 50 (units are millimeters). To be precise, the equations of the curve in parameter t are:
x = t
y = 3×ℜ(ζ(½ + ti))
z = 3×ℑ(ζ(½ + ti))
The straight line represents the critical line, and the displacements from the axis at each point are the real and imaginary parts of the function ζ(z), multiplied by three, because otherwise it just looks too skinny. Visible are ten non-trivial roots of the zeta function, at approximately the following values of ℑ(z):
14.13425
21.02204
25.01086
30.42488
32.93506
37.58618
40.91872
43.32707
48.00515
49.77383
Makes for a unique pendant, or earrings, if your neck is long enough (note: price is for one unit; if you want earrings, you need to order two, and supply your own earring hooks.)
Details

More From This Shop


